Creating beautiful polar coordinate plots in MATLAB
For a problem that I'm currently working on, I found myself having to visualize
some antenna patterns using MATLAB. To create polar coordinate plots, MATLAB
offers the polar method, which is unfortunately quite limited in
functionality. For this reason, Duane Hanselman created mmpolar, which brings
MATLAB's extensive handle graphics capabilities to polar plots.
I wanted to create some antenna pattern plots with a light grey background and
white grid lines, a color theme which is heavily inspired by Stanford's seaborn
library for python/matplotlib. One problem that I faced was that mmpolar by
default sets the color of the axis tick labels to the color of the axis grid
lines. This meant that whenever I set the grid lines to be white, my tick
labels would disappear in the white figure background, which was obviously
quite undesirable.
I wrote a small patch to fix this problem: It adds a TickLabelColor property
to each axis, which can be different from the GridColor property, which
controls the grid line color. Specifically, to set the color of the angle axis,
I can now set the TTickLabelColor property and to set the color of the
amplitude axis, I can set the RTickLabelColor property. Much better.
The results look like this:
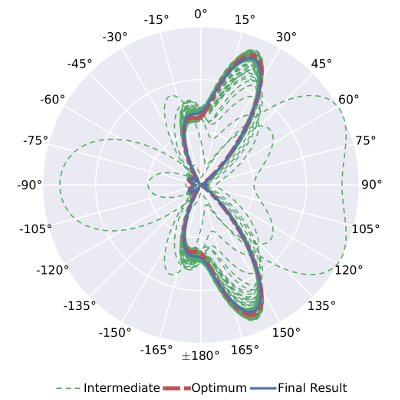
Below is the 'plotting part' of my script that is used to generate the above plot:
% plot the results using mmpolar
gridWidth = 1.5;
fontSize = 15;
fig = figure();
% first, the intermediate ones
interm_handle = mmpolar(patterns.angle_axis, patterns.f(:,1:end-1), ...
                        'Color', seaborn6(2), ...
                        'LineStyle', '--');
% now the optimal one
hold on
opt_handle = mmpolar(patterns.angle_axis, patterns.fopt, ...
                     'Color', seaborn6(3), ...
                     'LineStyle', '-.');
% now the result of the algo, also configure looks of the plot
res_handle = mmpolar(patterns.angle_axis, patterns.f(:,end), ...
                     'Color', seaborn6(1), ...
                     'LineStyle', '-', ...
                     'BackgroundColor', [0.9176470588 0.9176470588 0.9490196078], ...
                     'Style', 'compass',...
                     'BorderColor', 'white', ...
                     'FontSize', fontSize, ...
                     'RTickLabelVisible', 'off', ...
                     'RGridColor', 'white', ...
                     'RGridLineStyle', '-', ...
                     'RGridLineWidth', gridWidth, ...
                     'TTickLabelVisible', 'on', ...
                     'TGridColor', 'white', ...
                     'TTickLabelColor', 'k', ...
                     'TGridLineStyle', '-', ...
                     'TGridLineWidth', gridWidth);

% set the line widths
set(res_handle(1:end-2), 'LineWidth', 1.5); % the intermediate results
set(res_handle(end-1), 'LineWidth', 5); % the optimal value
set(res_handle(end), 'LineWidth', 3); % the final result

% legend
leg = legend([res_handle(1) res_handle(end-1) res_handle(end)], ...
             'Intermediate', 'Optimum', 'Final Result');
set(leg, 'Location', 'SouthOutside');
set(leg, 'Orientation', 'horizontal');
set(leg, 'EdgeColor', 'white');
set(leg, 'FontSize', fontSize);

% figure settings
% need this to print the actual background color
set(fig, 'Color', 'white');
set(fig, 'InvertHardCopy', 'off');
% set the size
xdim = 8;
ydim = 8;
%set(fig, 'PaperUnits', 'normalized');
set(fig, 'PaperSize', [xdim ydim]);
set(fig, 'PaperPositionMode', 'manual');
set(fig, 'PaperPosition', [0 0 xdim ydim]);

% print to file
fn = sprintf('%s/Summed_Pattern_0dBSNR', plotsDir);
print(gcf, fn, '-depsc')
To apply the patch, download mmpolar and the patch from the links posted
above, make sure they are in the same directory and run
patch < mmpolar_color_labels.patch
After that, make sure to put mmpolar.m in a directory that is listed in
MATLAB's path variable.
I hope this can be useful for someone!
Best,
Dennis