Adventures in self-hosted mapping
Table of Contents
Intro
Suppose you wanted to plot a few markers on an interactive world map and display them on your website. How would you go about it? That was a question I asked myself recently as I was thinking about the implementation of my snowboarding travel page. I wanted something like Google Maps, but definitely not Google Maps; something meaningfully self-hosted, but also not too complicated or brittle; something that looks and feels natural to visitors of my site, but was also relatively easy to implement. Since these are all pretty sketchy requirements, they naturally led me down an interesting and insightful rabbithole of web-based mapping. So relax, sit back, grab a beer, and let's look at some code.
Some googling
Obviously, the first thing you get when you put "embed a map on your website" into Google is a link to the Google Maps Embed API. I'm sure that this is very useful, but I don't want to be beholden to Google and I don't want to add an external dependency to my website. If Google decides to change the API, I will have to change all of my code, and maybe this happens during an inconvenient time or I forget to migrate all of my code in time and then I have a broken website. Not great. So Google is out. What else is out there?
I found Leaflet, which looks awesome. "An open-source JavaScript library for mobile-friendly interactive maps". Perfect! I sorta like JavaScript (now that I dipped my toes into it while building my Emoji reaction button feature) and the screenshot looks exactly like what I imagine when I think "embed a map on my website:"
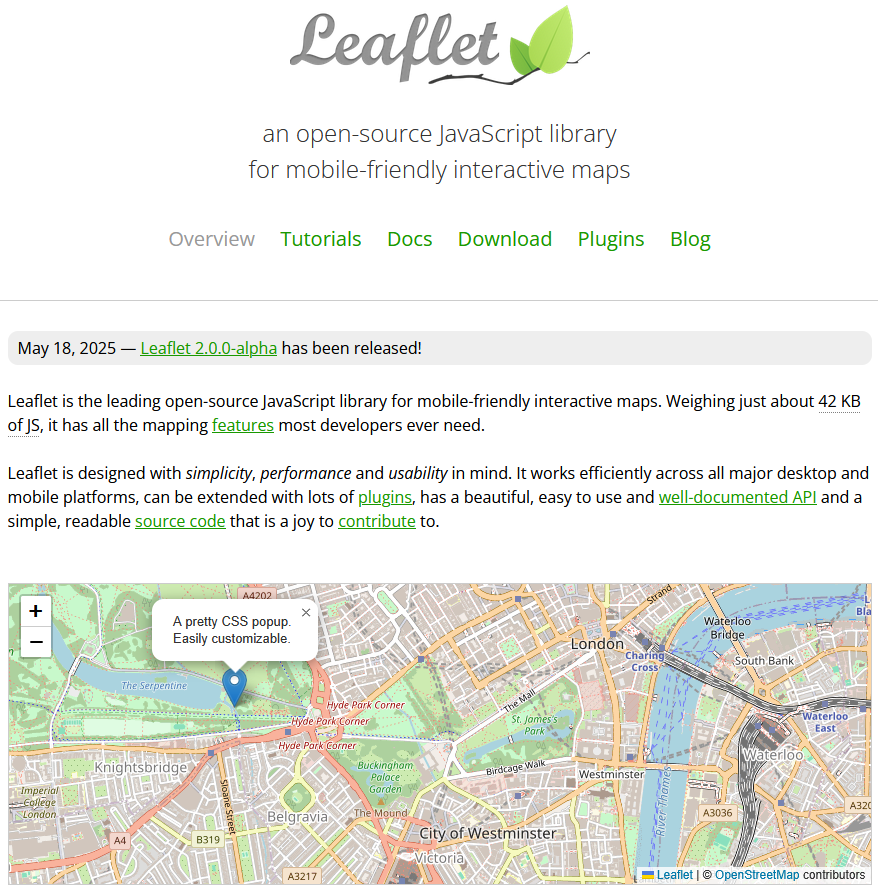
We have a nice map with street names, a marker, and a popup! exactly what I was thinking! Great, so how do I get this on my website?
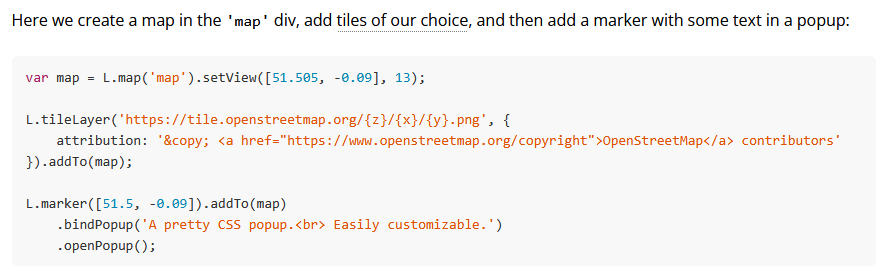
Hmmm… looks easy enough. We create a map object, initialize it somehow, and then we add a marker to it. But what's the deal with this OpenStreetMap URL? What are we doing here? (Also, I am beginning to fear that this creates a dependency on OpenStreetMap, which is something I am trying to avoid…) But let's take a look and go into the tutorials. What is a tileLayer?
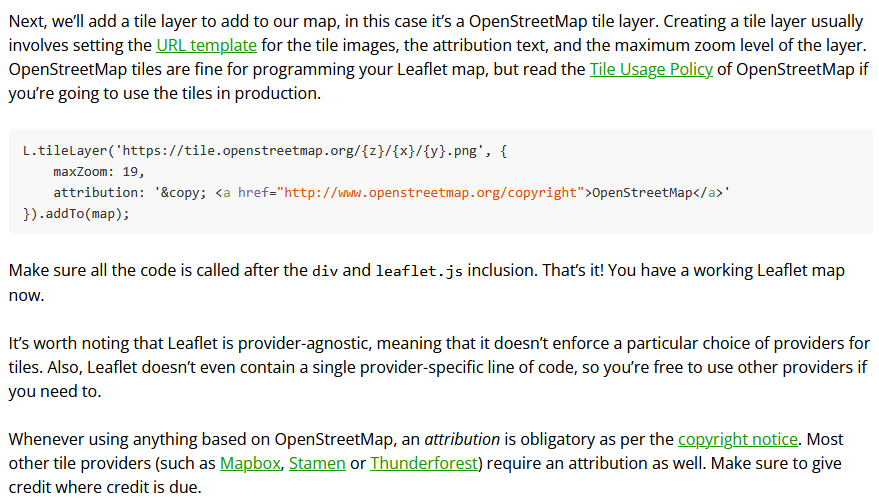
Alright. Tiles…tiles…? What's a Tile? Why do I have to go out and get these tiles from somewhere else? What's a tile provider? Why do I need this? I just want a map and put some markers on it!
Tiles
From Wikipedia—Tiled web map:
A tiled web map or tile map (also known as slippy map in OpenStreetMap), is a web map displayed by seamlessly joining dozens of individually requested data files, called "tiles". It is the most popular way to display and navigate maps, replacing other methods such as Web Map Service (WMS) which typically display a single large image, with arrow buttons to navigate to nearby areas. Google Maps was one of the first major mapping sites to use this technique. The first tiled web maps used raster tiles, before the emergence of vector tiles.
There are several advantages to tiled maps. Each time the user pans, most of the tiles are still relevant, and can be kept displayed, while new tiles are fetched. This greatly improves the user experience, compared to fetching a single map image for the whole viewport. It also allows individual tiles to be pre-computed, a task easy to parallelize. Also, displaying rendered images served from a web server is less computationally demanding than rendering images in the browser, a benefit over technologies such as Web Feature Service (WFS). While many map tiles are in raster format (a bitmap file such as PNG or JPEG), the number of suppliers of vector tiles is growing. Vector tiles are rendered by the client browser, which can thus add a custom style to the map. Vector map tiles may also be rotated separately from any text overlay so that the text remains readable.
OK. So basically a tiled web map is what Google Maps is doing. Every time you pan or zoom the map, you make an HTTP request to a tile server which serves you only the specific parts of the map that you are missing. Each zoom level of the map gets its own set of tiles. Fine. I get it. But it seems a little overkill for my application. I just want to display the Earth and plot a few markers on it, that's it! I don't need to build my own Google Maps!
And besides, how difficult is it to get these tiles, anyway? Let's google a bit more…OpenMapTiles…MapTiler (this one has a "pricing" site, uh oh)…OpenStreetMap data is free for everyone to use. Our tile servers are not. OK. Honestly, this is becoming a bit too much. Maybe I don't want this? And also, how would I serve these tiles from my puny VPS, anyway? Isn't the whole world a lot of data?
So let's take a step back, zoom out, and get back to the basics. What do I want to achieve here? It seems that I want:
- Something that looks like a world map which I can pan and zoom and
- Plot markers on it at known locations.
OK. Plot…plotting…wait! There was something!
d3.js
d3.js is a dataviz library that I have been interested in for a long time. For my personal and professional plotting needs so far I've always either used matplotlib or MATLAB's plotting features, but I've also always wondered about d3. The examples page shows all kinds of cool plots, including some maps! And I know that the New York Times makes extensive use of d3 with their awesome election coverage like this page.
It appears that there are plenty of examples on how to make a world map with d3. The basic idea is to load a GeoJSON (or better, TopoJSON) file describing the shape of all countries on Earth (see here for a GeoJSON Earth and here for a TopoJSON Earth) into a d3 SVG plot and then to add markers to it. A basic world map looks like this:
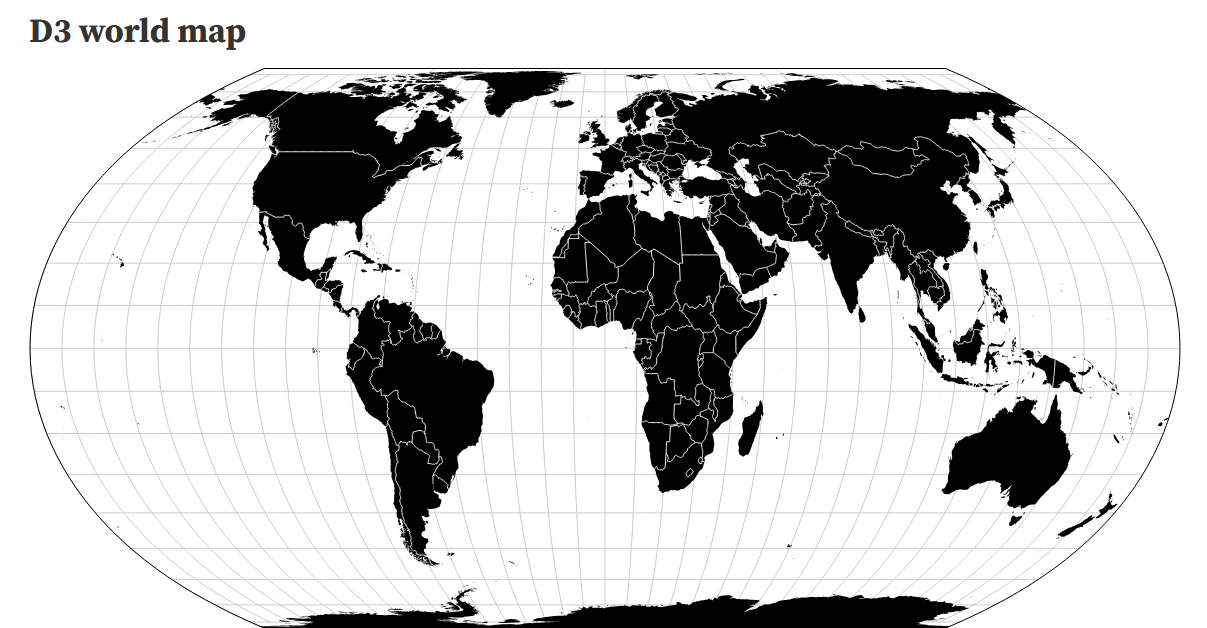
So this seems easy enough, right? Shall we, then?
First we need to load the d3 and TopoJSON libraries. Since I like to self-host, I serve them from my server. To add the relevant code to my HTML header during my static site generation with Org-mode, I add the following:
d3 can be downloaded from d3js.org and I pulled TopoJSON from cdnjs.com.
Now we need some GeoJSON points to plot. Let's make some in JavaScript.
Generate some GeoJSON points to plot
Note: The JS and CSS source code blocks in this post are all "inline" org-mode source blocks basically done like this. It's a nice way to embed JavaScript into the final HTML output both as executable code in <script> tags and as readable code blocks. I added some minification as an intermediate step, but it roughly works like in the linked reddit thread.
// make some GeoJSON out of a list of locations. extra credit if you can
// navigate the riddle of what these locations may represent...

const raw_data = `Alaska 60.7938 -145.1080
Hawaii 19.8261 -155.4701
Vandenberg 34.7482 -120.5224
Shriever 38.8013 -104.5241
Greenland 64.1885 -51.6305
New Hampshire 42.9476 -71.6212
USNO Washington 38.9217 -77.0664
Cape Canaveral 28.4685 -80.5544
Ecuador -0.8867 -80.4261
Uruguay -34.7620 -55.8979
Ascension -7.9721 -14.4027
South Africa -26.5470 27.7835
United Kingdon 50.4631 -4.9707
Bahrain 26.0344 50.5616
Diego Garcia -7.2721 72.3677
South Korea 37.4548 126.7639
Guam 13.5897 144.9133
Kwajalein 8.7198 167.7331
Australia -35.3473 139.0051
New Zealand -39.2609 177.8659`;

const locations = (() => {
    const locs = [];
    raw_data.split("\n").forEach(line => {
        const elems  = line.split(" ");
        const lon = elems.pop();
        const lat = elems.pop();
        const name = elems.join(" ");
        const id = elems.join("_").toLowerCase();
        locs.push({
            geometry: { type: "Point", coordinates: [+lon, +lat] },
            properties: { name: name, id: id, logo: null }
        });
    })
    return {type: "FeatureCollection", features: locs};
})();
We then need a div to attach our map to. In Org-mode, we can just do inline HTML:
Next, we need some code to generate the map. I do this by defining a WorldMap class which loads the TopoJSON, adds markers based on the GeoJSON points we defined, and makes the map zoomable (using d3-zoom) and reset-able (using a plan HTML button). I also highlight each country on mouse hover and zoom to the country containing each marker (stolen from the Zoom to bounding box example).
JavaScript for d3.js map
// a world map that can be panned, zoomed, etc. populated with some GeoJSON locations

class WorldMap {
    constructor(container) {
        // some styling etc.
        const aspect_ratio = window.screen.width > 760 ? 1.95 : 5.0 / 4.0;
        this.width = container.offsetWidth;
        this.height = this.width / aspect_ratio;
        this.transition_duration = 750;
        this.strokew = 0.7;
        this.marker_sz = 30;
        this.max_zoom = 30;

        // state
        this.current_country = null;
        this.zoom_k = 1;
        this.container = container;

        // some countries have special cases where the bounding box is too large
        // to be intuitive to the user (e.g., US territories, france and French
        // Guiana). for these countries we manually set a bounding box from
        // locations ([lon, lat] pairs) determined via google maps. (right
        // click, copy the location, paste here. no need to swap lat/lon, doing
        // that in the code below). this is used in the zoomToCountry function
        // defined below. the key is the country id as defined in the TopoJSON
        // file.
        this.customBoundingBoxes = (() => {
            const bb = (...points) => { return {
                type: "Feature",
                geometry: {type: "MultiPoint", coordinates: points.map((a) => {a.reverse(); return a;})}
            }};
            return {
                // United States
                840: bb([71.35253039479932, -167.41389563354986],
                        [60.18225380131154, -61.79225460292338],
                        [32.11086453205738, -119.20365476385375],
                        [24.874180405201567, -78.0859741811507]),
                // France
                250: bb([51.37034230578915, -7.821973431466914],
                        [51.55494178546891, 9.675957786795102],
                        [42.40029510491933, -7.06477226868229],
                        [43.05326072126442, 10.15332373724628]),
                // FIXME: NZ and Russia a buggy. can figure out later.
                // New Zealand
                // 554: bb([-33.19099961925115, 165.93883885459462],
                //         [-33.288351540876796, -176.25255765026654],
                //         [-47.28455694272225, 161.84169608969995],
                //         [-49.14568317580644, -179.0227848606215]),
                // Russia
                // 643: bb([76.73361439287555, 20.821061437976958],
                //         [77.779934101647, -167.61643657067302],
                //         [40.08907500026038, 33.125749080799196],
                //         [40.902842935876706, 136.2542161934248]),
            };
        })();
    }

    async load(topofile, locations) {
        // load the world map and locations
        const topo = await d3.json(topofile);
        this.shapes = topojson.feature(topo, topo.objects.countries);
        this.locations = locations;

        // the zoom object
        this.zoom = d3.zoom()
            .scaleExtent([1, this.max_zoom])
            .on("zoom", (event) => { // this is called on every zoom or pan
                const {transform} = event;
                // transform everything in the svg
                this.g.attr("transform", transform);
                this.zoom_k = transform.k;
                // scale stroke-width of the countries
                this.countries.attr("stroke-width", this.strokew / transform.k);
                // scale back the markers
                this.markers.attr("transform", (d, i, n) => {
                    // undo the global scale
                    const scale = 1/transform.k;
                    // re-project the marker back onto the globe
                    const lon = d.geometry.coordinates[0];
                    const lat = d.geometry.coordinates[1];
                    var proj = this.projection([lon, lat]);
                    // compute the proper shift value and set the new transform property
                    proj = [proj[0] - scale * this.marker_sz / 2, proj[1] - scale * this.marker_sz];
                    return `translate(${proj.join(",")}) scale(${scale})`
                })
                // change the cursor
                const pan = event.type === "zoom" && event?.sourceEvent?.type === "mousemove";
                if (pan) {
                    this.svg.style("cursor", "grabbing");
                } else {
                    this.svg.style("cursor", "zoom-in");
                }
                // update the info bar
                this.updateControlArea();
            })
            .on("end", () => { this.svg.style("cursor", "default") });

        // the tooltip (a regular floating html element)
        this.tooltip = d3.select(this.container)
            .append("div")
            .style("opacity", 0)
            .style("position", "absolute")
            .classed("tooltip", true);
        this.tooltip.append("img").attr("id", "tooltip-logo");
        this.tooltip.append("div").attr("id", "tooltip-text");

        // zoom indicator and reset button
        this.ctrl_area = d3.select(this.container)
            .append("span")
            .classed("ctrl-area", true)
        this.ctrl_area.append("span")
            .attr("id", "ctrl-area-zoom");
        this.ctrl_area.append("button")
            .attr("id", "ctrl-area-reset")
            .text("Reset")
            .on("click", this.reset.bind(this));
        this.updateControlArea();

        // Create the SVG container
        this.svg = d3.create("svg")
            .classed("map-content", true)
            .attr("viewBox", `0 0 ${this.width} ${this.height}`)
            .call(this.zoom)
            .on("click", this.reset.bind(this));

        // create the projection function
        this.projection = d3.geoNaturalEarth1()
            .fitSize([this.width, this.height], this.shapes);
        this.geoGenerator = d3.geoPath()
            .projection(this.projection);

        // group to hold everything
        this.g = this.svg.append("g");

        // add the countries
        this.countries = this.g.selectAll("path")
            .data(this.shapes.features)
            .join("path")
            .attr("d", d => this.geoGenerator(d))
            .classed("country", true)
            .attr("stroke-width", this.strokew)
            .on("click", (event, feature) => {
                if (!event.target)
                    return;
                if (this.current_country == feature) {
                    return this.reset();
                } else {
                    this.current_country = feature;
                }
                this.makeLocationActive(null);
                this.makeCountryActive(event.target);
                event.stopPropagation();
                this.zoomToCountry(feature);
            })
            .on("mouseover", (event, feature) => {
                this.tooltip.select("#tooltip-text").text(feature.properties.name);
                this.tooltip.select("#tooltip-logo").style("display", "none");
                const rect = this.tooltip.node().getBoundingClientRect();
                this.tooltip
                    .transition()
                    .duration(200)
                    .style("opacity", 0.9)
                    .style("left", 5 + "px")
                    .style("top", (this.height - rect.height - 5) + "px");
            })
            .on("mouseout", (event, feature) => {
                this.tooltip
                    .transition()
                    .duration(200)
                    .style("opacity", 0);
            });

        // add markers

        // first get an svg symbol for the marker (some inkscape magic, stolen
        // from
        // https://nohat.cc/f/svg-pin-map/freesvgorg50742-202109140328.html, see
        // img/gallery/map-pin-dennis2.svg)
        var map_pin = this.svg.append("symbol")
            .attr("id", "map-pin")
            .attr("width", 35)
            .attr("height", 35)
            .attr("viewBox", "0 0 35 35");
        map_pin.append("path")
            .attr("d", "M 10.464044,3.7408996 C 8.9682449,5.3372942 8.031323,7.6627881 " +
                  "8.0677035,9.8501619 c 0.075952,4.5709571 2.1363335,6.3012991 " +
                  "5.4312295,12.5923621 1.186882,2.76832 2.425634,5.697555 3.603791,10.54899 " +
                  "0.163729,0.715622 0.323403,1.380336 0.397275,1.437925 0.07383,0.05765 " +
                  "0.233541,-0.60944 0.397278,-1.325066 1.178154,-4.851435 2.41691,-7.778338 " +
                  "3.603791,-10.546655 3.294897,-6.291066 5.355236,-8.02142 5.43123,-12.5923771 " +
                  "C 26.968682,7.7779671 26.029441,5.4501537 24.533638,3.8537591 22.824933,2.0301486 " +
                  "20.247679,0.68054565 17.499999,0.62410832 14.752323,0.56763688 12.172749,1.9172891 " +
                  "10.464044,3.7408996 Z")
            .attr("style", "fill: var(--mark-bg-fill); stroke: var(--mark-bg-stroke); stroke-width: 0.313686; stroke-miterlimit: 4;")
        map_pin.append("circle")
            .attr("r", "3.6088443")
            .attr("cy", "10.020082")
            .attr("cx", "17.5")
            .attr("style", "fill: var(--mark-fg-fill); stroke-width: 0;")

        this.markers = this.g.selectAll(".mark")
            .data(this.locations)
            .enter()
            .append("use")
            .attr("class", "mark")
            .attr('width', this.marker_sz)
            .attr('height', this.marker_sz)
            .attr("href", "#map-pin")
            .attr("transform", (d) => {
                const lon = d.geometry.coordinates[0];
                const lat = d.geometry.coordinates[1];
                var proj = this.projection([lon, lat]);
                // shift so that the marker is pointing to the point
                proj = [proj[0] - this.marker_sz/2, proj[1] - this.marker_sz];
                return `translate(${proj.join(",")}) scale(1)`
            })
            .on("mouseover", (event, feature) => {
                this.svg.style("cursor", "pointer");
                this.moveTooltipToLocation(feature, event.target, 100);
            })
            .on("mouseout", (event) => {
                this.svg.style("cursor", "default");
                this.tooltip
                    .transition()
                    .duration(100)
                    .style("opacity", 0);
            })
            .on("click", (event, feature) => {
                event.stopPropagation();
                this.makeLocationActive(feature, event.target);
            });

        // set up the location sections (need to add a class attribute)
        this.locations.forEach((g) => {
            d3.select("#outline-container-" + g.properties.id)
                .attr("class", "location-info");
        });

        return this.svg;
    }

    // reset the svg container to the default view, deselect any current active countries of locations
    reset() {
        this.current_country = null;
        this.makeCountryActive(null);
        this.makeLocationActive(null);
        this.svg.transition()
            .duration(this.transition_duration)
            .call(this.zoom.transform,
                  d3.zoomIdentity
                  .translate(0, 0)
                  .scale(1));
    }

    // make a current location active, i.e., display it and not any others
    makeLocationActive(feature, dom_elem) {
        const id = feature ? feature.properties.id : null;
        this.locations.forEach((g) => {
            const cid = g.properties.id; // this is the CUSTOM_ID property
            if (id === cid) {
                // find the country this location is in and make it active
                const parentCountry = this.countries.filter((d) => {
                    return d3.geoContains(d, feature.geometry.coordinates);
                });
                if (parentCountry.size() > 0) {
                    this.makeCountryActive(parentCountry.node());
                    this.current_country = parentCountry.datum();
                    this.zoomToCountry(parentCountry.datum());
                    this.moveTooltipToLocation(feature, dom_elem, 0);
                }
            }
        });
    }

    // elem is a DOM element (so we need the actual country path here)
    makeCountryActive(elem) {
        // first make all countries and locations inactive
        d3.selectAll(".country").classed("active", false);
        // make one active
        if (elem) {
            d3.select(elem).classed("active", true);
        }
    }

    // feature is the actual GeoJSON datum
    zoomToCountry(feature) {
        // get the bounding box of the country
        const [[x0, y0], [x1, y1]] = this.geoGenerator.bounds(this.customBoundingBoxes[+feature.id] || feature);
        // compure the scale factor
        var k = Math.min(12, 0.9 / Math.max((x1 - x0) / this.width, (y1 - y0) / this.height));
        // compute the translation
        var [t_x, t_y] = [-(x0 + x1) / 2, -(y0 + y1) / 2];
        // apply the transform on the SVG object
        this.svg.transition()
            .duration(this.transition_duration)
            .call(this.zoom.transform,
                  d3.zoomIdentity
                  .translate(this.width / 2, this.height / 2)
                  .scale(k)
                  .translate(t_x, t_y),
                  d3.pointer(event, this.svg.node()));
    }

    updateControlArea() {
        // set the zoom level
        this.ctrl_area.select("#ctrl-area-zoom")
            .text("🔍: " + (this.zoom_k * 100).toFixed(0) + "%");
        // update the position
        const rect = this.ctrl_area.node().getBoundingClientRect();
        this.ctrl_area
            .style("top", (this.height - rect.height - 5) + "px")
            .style("left", (this.width - rect.width - 5) + "px")
    }

    moveTooltipToLocation(feature, dom_elem, duration) {
        // set the tooltip contents before getting its width
        if (feature.properties.logo) {
            this.tooltip.select("#tooltip-logo")
                .style("display", "block")
                .style("height", (Math.min(this.height/6, 60) - 10) + "px")
                .style("width", "auto")
                .attr("src", feature.properties.logo);
        }
        this.tooltip.select("#tooltip-text").text(feature.properties.name)

        // compute a fixed position for the tooltip
        const rect = this.tooltip.node().getBoundingClientRect();
        this.tooltip
            .transition()
            .duration(duration)
            .style("top", (this.height - rect.height - 5) + "px")
            .style("left", 5 + "px")
            .style("opacity", 0.9);
    }
}
Let's now make this map look sort of like a world map. Water is blue, right? Let's do that and keep the countries white. Off-white maybe. We also need to style the markers a bit and buttons and popups also need to be styled, so let's write some CSS:
CSS for d3.js map
#d3-map-container {
    position: relative;
    margin-top: 10px;
    margin-bottom: 0px;

    width: calc(100% - 2px); /* don't ask */
}

:root {
    --map-fg-color: var(--main-bg-color);
    --map-bg-color: #c6dbe9;
}

/* this directly styles the svg element */
.map-content {
    border: solid;
    border-width: 1px;
    border-radius: 5px;
    padding: 0;

    background-color: var(--map-bg-color);

    .country {
        stroke: var(--map-bg-color);
        fill: var(--map-fg-color);
    }

    .country:hover, .country.active {
        fill: var(--code-bg-color);
    }

    /* style the map markers. need to use CSS variables for this... */
    use.mark {
        /* the mark "background" */
        --mark-bg-fill: #ff4646;
        --mark-bg-stroke: #d73534;
        /* the little circle in the mark */
        --mark-fg-fill: #590000;
    }

    use.mark:hover {
        /* the mark "background" */
        --mark-bg-fill: #590000;
        --mark-bg-stroke: #d73534;
        /* the little circle in the mark */
        --mark-fg-fill: #ff4646;
    }
}

.tooltip, .ctrl-area {
    font-family: "Charter", "serif";
    font-size: 12pt;
}

.tooltip {
    background-color: var(--map-fg-color);
    stroke: var(--main-fg-color);

    display: flex;
    flex-direction: column;
    text-align: center;

    border: solid;
    border-width: 1px;
    border-radius: 5px;

    padding: 3px 5px 3px 5px;

}

/* the control area */
.ctrl-area {
    position: absolute;
    display: inline-flex;
    gap: 0.5rem;
    opacity: 0.9;
    align-items: center;

    background-color: var(--map-fg-color);
    stroke: var(--main-fg-color);

    border: solid;
    border-width: 1px;
    border-radius: 5px;

    padding: 3px 5px 3px 5px;

    button {
        background-color: var(--code-bg-color);
        color: var(--main-fg-color);
        margin-right: 0.4rem;
        border-color: var(--main-fg-color);
        border-style: solid;
        border-width: 1px;
        border-radius: 4px;
        padding: 0.2rem;
        font-family: inherit;
        font-size: inherit;
    }

    button:hover
    {
        background-color: var(--main-bg-color);
        transition-duration: 0.2s;
    }

}
Finally, we need to actually load the map once the page is done loading:
Startup code for d3.js map
const d3Container = document.getElementById("d3-map-container")
const d3Map = new WorldMap(d3Container);
document.addEventListener("DOMContentLoaded", async () => {
    d3Map.load("/res/countries-50m.json", locations.features)
    .then(svg => {
        d3Map.makeLocationActive(null);
        d3Container.append(svg.node());
    });
})
The end result looks like this:
Pretty cool, right? An interactive map, clickable, zoomable, panable, styled, with markers; basically all that I am looking for! You should take a second to play with it! It's fun!
But…phew…honestly…that…was…a lot? Throughout the entire experience of building this map, I oftentimes had to take a few steps back and ask myself questions like: "Why am I manually moving these markers around the map while I am zooming, just to keep them static on the map?" (cf. StackOverflow)
This method just seems like an awful lot of code just to display a relatively basic looking map without many features. Sure, it'll work as a map and it does meet my rather vaguely defined requirements, but something doesn't feel right here. I think the main issue with this approach is that even though mapping support in d3 is great, d3 really is not a mapping library. On the contrary; d3 is a plotting and dataviz library that can be beat into submission to display an interactive map. But d3 does not want to be a map, it is too low-level and generic for that.
So at this point, while I am happy with the result, I am also casually googling around again, looking for inspiration on how others have done maps on their website. This time around, having built my minimum viable product already (and having picked up some more JavaScript in the process), I am opening my mind up to new ideas yet again.
Tiles, redux
To quote myself:
And besides, how difficult is it to get these tiles, anyway?
As it turns out after digging around a bit more, generating a custom set of tiles and self-hosting them is not difficult at all, thanks to the protomaps project.
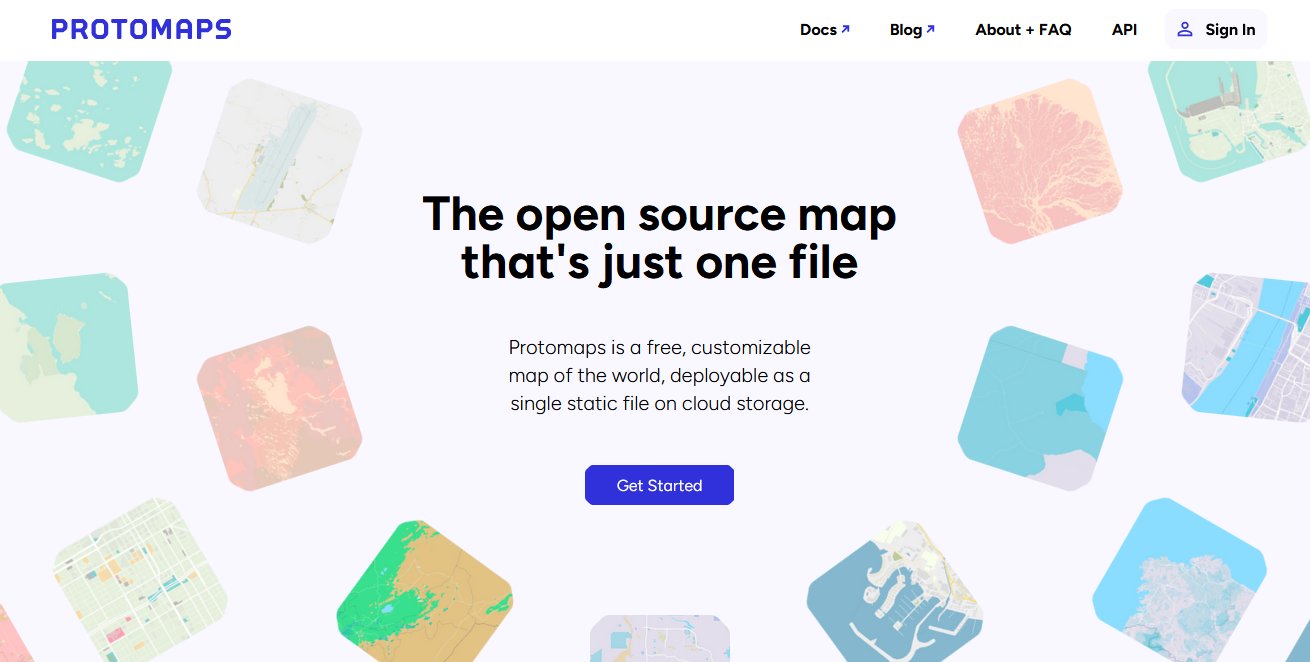
The protomaps project basically gives us everything we need to self-host a Google Maps-style map on the web. It provides the specification of the PMTiles format, which contains Z/X/Y (remember the scary URL template in the leaflet example from earlier?) addressable vector tile data within a single file. Having all of the tile data contained in a single file is nice for self-hosting, since it's relatively easy to host a single file somewhere. The project also provides daily builds of the entire world derived from publicly-available OpenStreetMap data. At the time of the writing of this post, a full set of tiles covering the entire planet is about 120 GiB.
The protomaps project also maintains a tool, written in Go (so it's a nice statically linked binary available for and compatible with most OS's), which can be used to generate custom (think either subsets of the planet, less details, or lower zoom levels) PMTiles files from these 120 GiB "basemaps". In addition the go-pmtiles tool can then be used to serve these files over the web to expose exactly the kind of Z/X/Y API that we need. Pretty good!
The docs are a great resource for figuring out exactly how to use protomaps and I also found a few very useful blog posts. Thomas shows us how to serve PMTiles files using Cloudflare Workers and Cloudflare Pages. Simon is serving only the Half Moon Bay area by fetching the entire PMTiles file in JavaScript. Ward has a series of posts, this being the most recent one, about how to serve maps using protomaps, first with our familiar friend Leaflet, and later with a different client-side library called MapLibre GL JS.
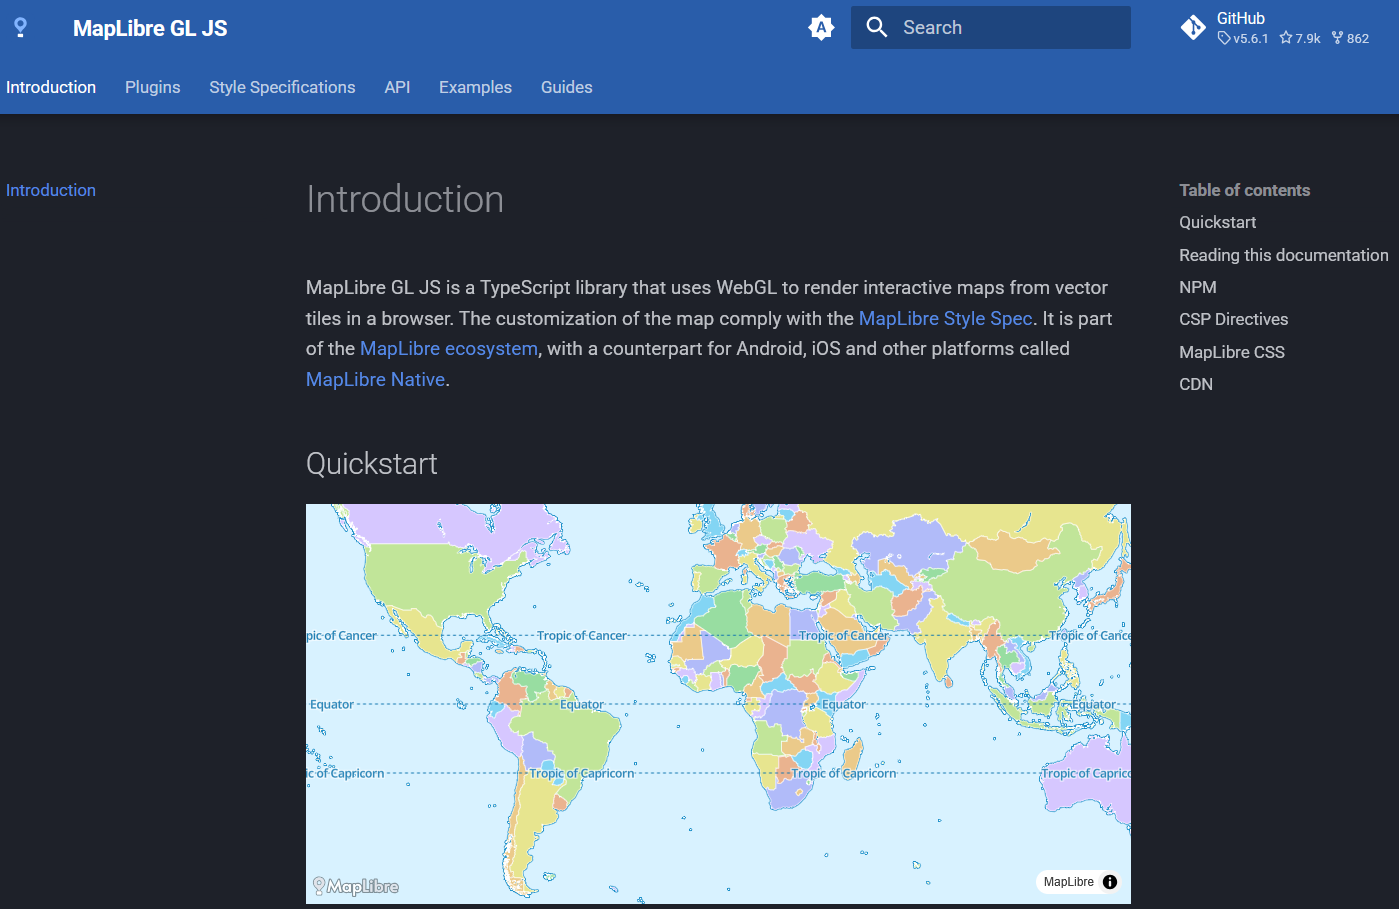
Thomas' and Simon's solutions also use MapLibre GL JS instead of Leaflet. Although protomaps does seem to officially support Leaflet, it appears to me that the vector tiles of the PMTiles format are more naturally suited for the WebGL-based MapLibre GL JS library. And thus, the last piece of the puzzle was found.
The second iteration
The client
OK, good, let's rebuild the map then! Similar to what we did before, we need to load the MapLibre GL JS and CSS sources and we need a div to attach the map to:
# somewhere in the header # ... # Add this org code where you want the map to appear
I downloaded the JS and CSS sources from unpkg.
Now that we are using a true mapping library, the code to configure and initialize the map is rather simple: (OK, fine, I had to hack the Popup a little bit to get the desired effect, but it is overall much easier than having to do all of this by hand with d3.js)
JavaScript for MapLibre/PMTiles map
// -*- mode: js; -*-

// some js that can be used to create a clickable, zoomable world map with
// clickable logo popups, etc.

// a home button for maplibre-gl-js that flies to the starting location
// cc: https://stackoverflow.com/a/74283884
class ResetControl {

    // can pass in a reset function that is called on click as well
    constructor(reset_fun) {
        this._reset_fun = reset_fun;
    }

    onAdd(map) {
        this._map = map;
        this._container = document.createElement('div');
        this._container.className = 'maplibregl-ctrl maplibregl-ctrl-group';

        this._container.addEventListener('contextmenu', (e) => e.preventDefault());
        this._container.addEventListener('click', (e) => this.onClick());

        this._container.innerHTML = `<button type="button" title="Reset map" aria-label="Reset map" aria-disabled="false">
        <svg focusable="false" viewBox="0 0 24 24" aria-hidden="true" style="font-size: 20px;"><title>Reset map</title><path d="M10 20v-6h4v6h5v-8h3L12 3 2 12h3v8z"></path></svg>
        </button>`;

        return this._container;
    }

    onClick() {
        this._reset_fun && this._reset_fun();
        if (this._map.popups) {
            this._map.popups.forEach((p)=> { p.remove(); })
        }
        this._map.flyTo({center: starting_location, zoom: starting_zoom, speed: 1,
                         pitch: 0, roll: 0, bearing: 0});
    }

    onRemove() {
        this._container.parentNode.removeChild(this._container);
        this._map = undefined;
    }
}

// generate a popup from a GeoJSON feature with the logo and name as contents
// and the correct value of the offset property
function createPopup(location) {
    const logo_height = Math.min(document.getElementById("map-container").offsetHeight / 6, 60) - 10;
    // generate and style the popup
    const elem = document.createElement("div");
    elem.className = "map-popup";
    if (location.properties.logo) {
        const img = document.createElement("img");
        img.className = "map-popup-logo";
        img.setAttribute("src", location.properties.logo)
        elem.append(img);
    }
    const text = document.createElement("div");
    text.className = "map-popup-text";
    text.textContent = location.properties.name;
    elem.append(text);

    // ok so this is a bit of a hack. For reasons, I don't want to bind the
    // popup to a marker. I instead wrap each popup in closures. however, one
    // nice thing that happens when you bind a popup to a marker is that the
    // library computes the offset of the marker for you. see here:
    // https://github.com/maplibre/maplibre-gl-js/blob/1a8ef7ff9848105e49a29e3f5e59a52c14b9fbe2/src/ui/marker.ts#L447
    // since I don't get this for free anymore, I set the offset here and
    // everything should work... Note that if the default marker changes, this
    // will have to be recomputed...
    const markerHeight = 41 - (5.8 / 2);
    const markerRadius = 13.5;
    const linearOffset = Math.abs(markerRadius) / Math.SQRT2;
    const offset = {
        'top': [0, 0],
        'top-left': [0, 0],
        'top-right': [0, 0],
        'bottom': [0, -markerHeight],
        'bottom-left': [linearOffset, (markerHeight - markerRadius + linearOffset) * -1],
        'bottom-right': [-linearOffset, (markerHeight - markerRadius + linearOffset) * -1],
        'left': [markerRadius, (markerHeight - markerRadius) * -1],
        'right': [-markerRadius, (markerHeight - markerRadius) * -1]
    };

    const popup = new maplibregl.Popup({
        closeButton: true,
        closeOnClick: false,
        closeOnMove: false,
        offset: offset,
    });
    popup.setLngLat(location.geometry.coordinates);
    popup.setDOMContent(elem);

    return popup;
}

// configure the map object after it is loaded
function configureMap(map, places_geoJSON, activate_fun, reset_fun) {
    map.on("load", async () => {
        // add zoom and reset buttons
        map.addControl(new maplibregl.NavigationControl({showZoom: true, showCompass: false}), "bottom-left");
        map.addControl(new ResetControl(reset_fun), "bottom-left");

        // save the popups as part of the map... dirty but whatever.
        map.popups = [];

        // add clickable markers for location data ("locations" variable is an
        // array of GeoJSON Features that I generated from org-mode)
        places_geoJSON.features.forEach((loc) => {
            const marker = new maplibregl.Marker({className: "map-marker", color: "#ff4646"})
                .setLngLat(loc.geometry.coordinates)
                .addTo(map)

            // add a reference to the location object to the marker
            marker.feature = loc;

            // create a popup, but don't bind it to the marker (see comment
            // above). also don't show it at first.
            const popup = createPopup(loc);
            popup.remove();
            map.popups.push(popup);

            // show a popup when hovering over a marker. however, when clicked,
            // we want the popup to stay!
            const removePopup = (e) => { popup.remove(); }
            const addPopup = (e) => {
                marker.getElement().addEventListener("mouseleave", removePopup);
                popup.addTo(map);
            }
            marker.getElement().addEventListener("mouseenter", addPopup);

            // zoom to the marker and activate the location on click
            const active_zoom = 6.4; // when zoomed in on a location
            marker.getElement().addEventListener("click", (e) => {
                marker.getElement().removeEventListener("mouseleave", removePopup);
                activate_fun && activate_fun(marker.feature);
                map.flyTo({center: marker.getLngLat(), zoom: active_zoom, speed: 1,
                           pitch: 0, roll: 0, bearing: 0});
            });

            // save the markers and popups. we mainly need the popups
            marker.addTo(map);
        });
    });
}
What I am doing here is basically loading the GeoJSON points I generated earlier and adding Markers and Popups for each location.
Next, we want to style the container a bit and initialize it upon page load.
CSS for MapLibre/PMTiles map
/* -*- mode: css; -*- */

.map-container {
    position: relative;
    margin-top: 10px;
    margin-bottom: 0px;

    border: solid;
    border-width: 1px;
    border-radius: 5px;
    padding: 0;

    aspect-ratio: 1.95;
}

.map-popup {
    display: flex;
    flex-direction: column;
    text-align: center;
}

.map-popup-logo {
    max-height: 55px;
}

.map-marker {
    cursor: pointer;
}

@media (max-width: 760px) {
    .map-container {
        aspect-ratio: 5 / 4;
    }
}

/* extra style for the location info boxes */
.location-info {
    /* by default don't show */
    display: none;

    border: solid;
    border-width: 1px;
    border-radius: 5px;

    margin-top: 15px;
    margin-bottom: 15px;

    /* honestly unclear why 12, but it's right */
    width: calc(100% - 12px);
    padding: 3px 5px 3px 5px;
}

.location-info h2 {
    text-align: center;
    margin: 5px 0 10px 0;
}
Startup code for MapLibre/PMTiles map
// hold the map object
let ml_map;
// we always start out with a full view of the world
const starting_location = window.screen.width > 760 ? [11.344, 26.352] : [7.758, 34.834];
const starting_zoom = window.screen.width > 760 ? 1 : - 0.404;
// initialize the map on page load
document.addEventListener("DOMContentLoaded", async () => {
    fetch("/res/pmtiles-light.json")
        .then(async (r) => { return r.json() })
        .then((s) => {
            ml_map = new maplibregl.Map({
                container: 'map-container',
                style: s,
                center: starting_location,
                zoom: starting_zoom,
            });
        })
        .then(async () => {
            configureMap(ml_map, locations);
        })
        .catch((e) => {
            console.log(e);
        });
});
Configuring the map is relatively straightforward. The only wrinkle here is the style parameter. This is a big JSON object which, among other things like defining the maps' overall style, sets up the maps' layer and tile sources. This means that in order to connect the map to our personal tile server, we need to get this style file right. Luckily, with the help of the protomaps documentation, a base style is relatively easy to obtain by clicking the "Get style JSON" on maps.protomaps.com after selecting one of the available base styles (I chose the light flavor).
The default style JSON we get from maps.protomaps.com looks something like this:
{
    "version": 8,
    "sources": {
        "protomaps": {
            "type": "vector",
            "attribution": "<a href=\"https://github.com/protomaps/basemaps\">Protomaps</a> © <a href=\"https://openstreetmap.org\">OpenStreetMap</a>",
            "url": "pmtiles://https://demo-bucket.protomaps.com/v4.pmtiles"
        }
    },
    "layers": [
        // ... a lot of other stuff
    ]
}
I don't have the desire to really change the layer styling (Thomas seems to have built a page to explore this further), so let's focus on the configuration aspects here. The url key in the code above indicates that this default setup assumes that the client uses the pmtiles JavaScript library (using the pmtiles:// protocol) as a plugin to MapLibre GL JS to pull the tiles. More info on that in the docs.
While I am sure this works, I didn't end up using this setup. It's nice that this scheme lets the user interact with a PMTiles file in some S3 bucket somewhere, but I don't really use cloud storage for my personal website. (I run a very simple nginx setup behind the Cloudflare free plan.) Also, this method introduces another JavaScript dependency (pmtiles) and it appears to implicitly link me to Maplibre GL JS forever. What if I want to change it up and switch to Leaflet (or some other client) in the future?
So instead of using the pmtiles:// protocol and JavaScript library, I followed this encouraging note in the protomaps docs:
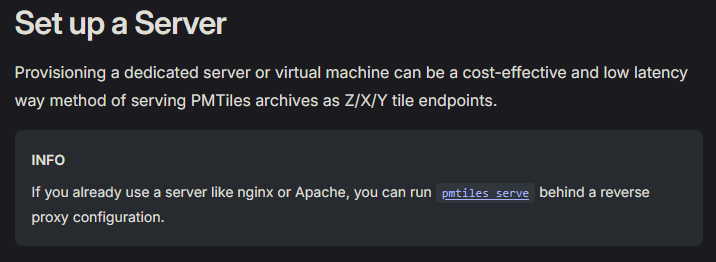
The next section briefly describes how I set up the server, but to cap this off, my style file looks something like this:
{
  "version": 8,
  "sources": {
    "protomaps": {
      "type": "vector",
      "attribution": "<a href=\"https://github.com/protomaps/basemaps\">Protomaps</a> © <a href=\"https://openstreetmap.org\">OpenStreetMap</a>",
      "tiles": ["https://tiles.ogbe.net/world_20250703/{z}/{x}/{y}.mvt"],
      "maxzoom": 10
    }
  },
  "sprite": "https://tiles.ogbe.net/assets/sprites/v4/light",
  "glyphs": "https://tiles.ogbe.net/assets/fonts/{fontstack}/{range}.pbf",
  "layers": [
      // ... all the rest
  ]
}
Here I am using the tiles key to point Maplibre GL JS to my personal tile server, complete with the scary Z/X/Y template URL and all. In addition, since I really like self hosting everything, I also follow the docs to point MapLibre GL JS to locally-hosted sprites and glyphs, downloaded from here.
The tile server
Although having some amount of detail, e. g., street names, rivers, lakes, etc., is very nice, there is a tradeoff between the file size of the PMTiles file to host and the amount of detail in the map. I ended up generating a roughly 3.3 GiB file using go-pmtiles by specifying the maximum zoom level as --maxzoom=10:
pmtiles extract https://build.protomaps.com/20250703.pmtiles world_20250703.pmtiles --maxzoom=10
Here, I pointed go-pmtiles to the daily build from July 3, 2025, which is when I originally set all of this up. I really liked the fact that I didn't have to download the entire 120 GiB full planet, but instead go-pmtiles can work with PMTiles files served via HTTP.
And that's roughly it! I uploaded the file to my server and configured my Docker/nginx proxy setup to just run go-pmtiles serve, basically something like:
pmtiles serve /path/to/folder/with/tiles --public-url https://tiles.ogbe.net --cors https://ogbe.net
Super simple! In my actual setup, I am using the go-pmtiles Docker image, but since this is a Go app, there is not much difference. I proxy any requests to the URL via a standard nginx configuration, and that's it!
The final product
And finally, here it is! A custom, completely self-hosted, dynamic map with the standard web map user experience and custom markers, extendable with standard JS, HTML, and CSS. I really like this one! It's fun to play with, and since this was the second iteration, I also made sure to make it such that I can embed similar maps on my website for other applications. Who knows what else I will eventually use this for, but I am sure that this will power my snowboarding travel page for the foreseeable future.
Concluding thoughts
This was fun. Having to work this out was also a lot of work. But I really like the end result. I'm very impressed by protomaps and how simple and easy using the PMTiles format is. I especially like how flexible the format is and how many different deployment mechanisms exist already. If I wanted to switch to cloud storage in the future, this would be easy to do. If I wanted to change my client library back to Leaflet (or some other mapping client which understands Z/X/Y tiles), that's also very easy. I especially like that I am able to self-host all of this.
Getting experience with d3.js was enlightening. Although I ended up tossing my d3-based implementation out, I really enjoyed working with d3. I can see myself creating really nice online and offline (i.e., for journal and conference papers) data visualizations with d3 in the future.
The process of first rejecting the seemingly complicated tile-based solution, only to return to it after going in the completely opposite direction, was also an interesting one. If there were a moral to this story, I guess, it would be that sometimes the more complicated approach is indeed the correct one. Minimalism for the sake of minimalism is—as evidenced—not always the better approach…